I wrote this for Politico Europe, but they weren’t interested after much editing about. Apparently there were too many charts.
A clear statement about migration, says Theresa May of the vote for Brexit. The last thing you’ll find in the data is clarity. Or migration.
There has been a wealth of efforts to understand Brexit through data. But the most telling statistic in most of them is the R^2 value, the measure of how well a regression line fits the data. The higher the R^2, the more of the spread in your data you’ve managed to explain. Famously, although there is a faint correlation between some measures of migration and the vote, the R^2 value is pathetic – the data set is nothing but outliers.
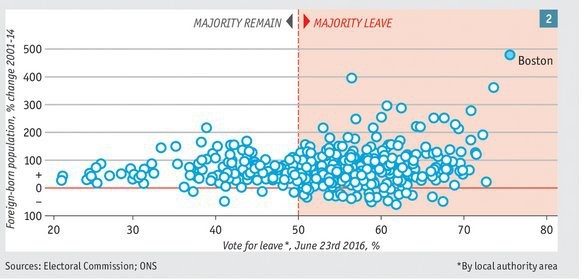
It gets worse. Some analysts tried to save migration as an explanation by looking at the change in foreign-born population, rather than its level. This chart from The Economist is the classic statement. Perhaps the voters were shocked and bewildered by the speed of change, rather than its content, or something like that. Or maybe it’s a soft racist argument like Jacques Chirac’s Le bruit et l’odeur speech.
The problem is, again, the R^2 – without a very few extreme outliers, mostly very conservative small towns in the Fens with significant numbers of migrant farm workers, there wouldn’t be any effect at all, as Jo Mitchell points out here. You’ll notice they didn’t quote an R^2.
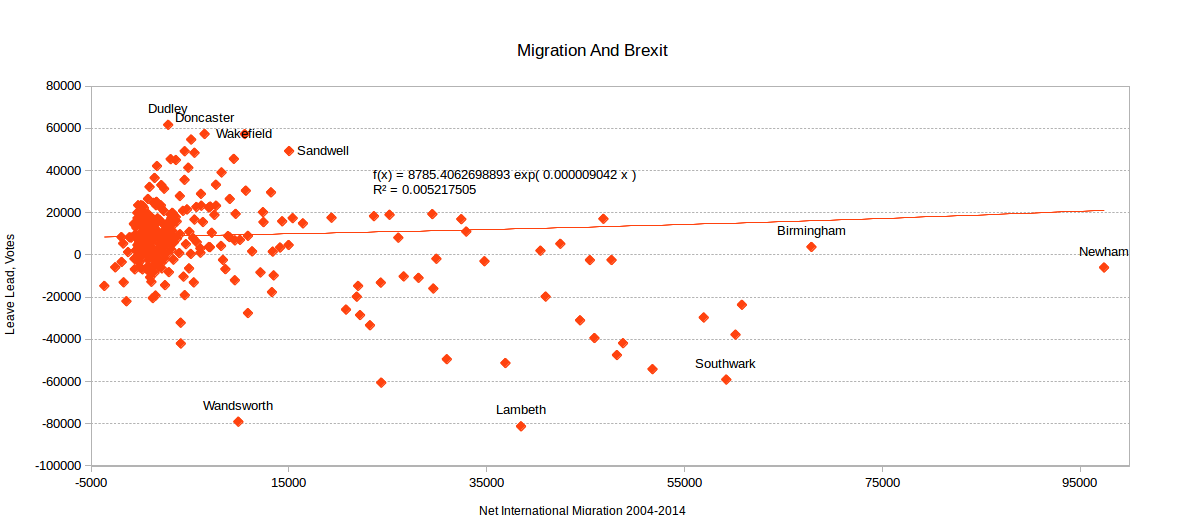
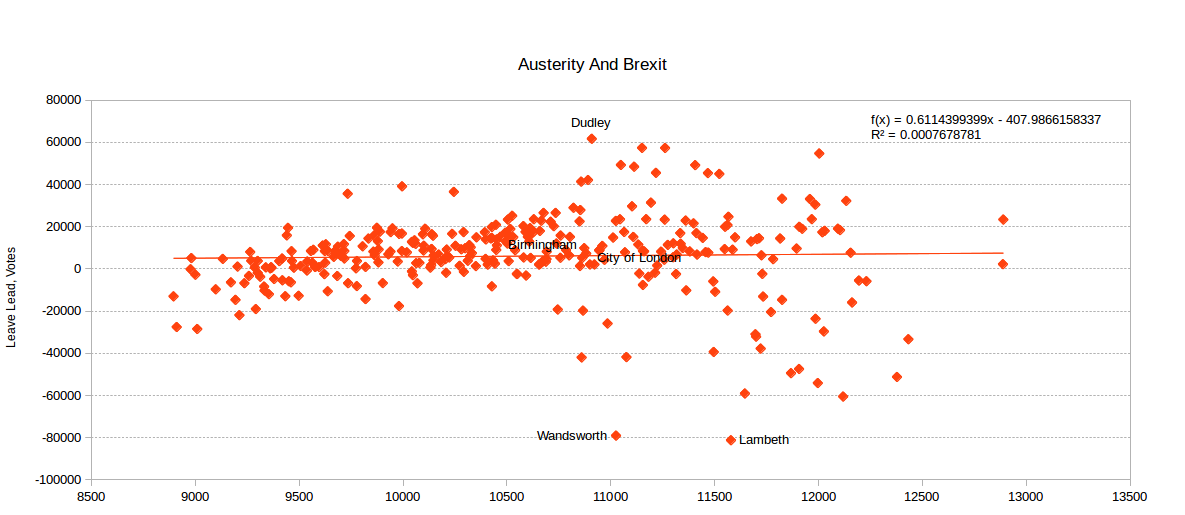
It gets still worse, though. Those outliers are dramatic, but they disappear when we control for the size of their population (from here). Small populations exaggerate all percentage changes; they show extremely high rates of immigration precisely because they have so few immigrants, and even if they voted Leave by a big margin, they had little impact on the contest because they have so few voters. We can deal with this by plotting votes rather than percentages – I’ve plotted the net Leave lead, i.e. Leave minus Remain, giving us each local authority’s contribution to the overall result.
As you can see, the Fenland outliers have vanished and so has the correlation. It makes sense; nobody ever won a general election in South Holland and the Deepings, a constituency that has been Conservative since 1922. Instead, a clutch of populous, Leave-leaning but contested, urban but not metropolitan districts emerge as the key battlegrounds. Dudley, for example, contributed 61,666 net Leave votes.
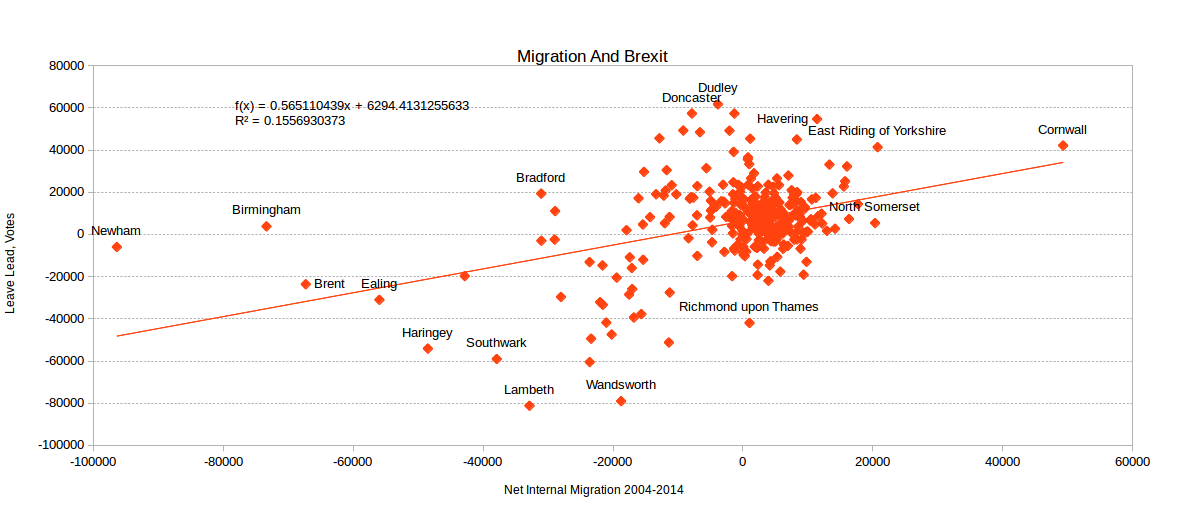
Let’s try something else. One argument – classically put by Daniel Davies in Vox – is that the problem is migration, but it’s internal migration. Post-industrial northern towns and the run-down seaside are emptying out as the young seek opportunity in the big city. It’s an elegant argument, with all the more emotional force because both Dan and I did just that ourselves. Unfortunately, the data doesn’t stand it up.
In fact, it’s the other way round, the correlation is quite strong, and the R^2 is at least less bad. This seems baffling; London is actually more populous now than it’s ever been, and deeply Remainy. Also, Cornwall is hardly the land of opportunity. The explanation may be age structure – young people flock into the big cities, retirees go the other way – but we’re already trying to save our hypothesis by fitting stories to an unconvincing data set. It needs a lot of nuance.
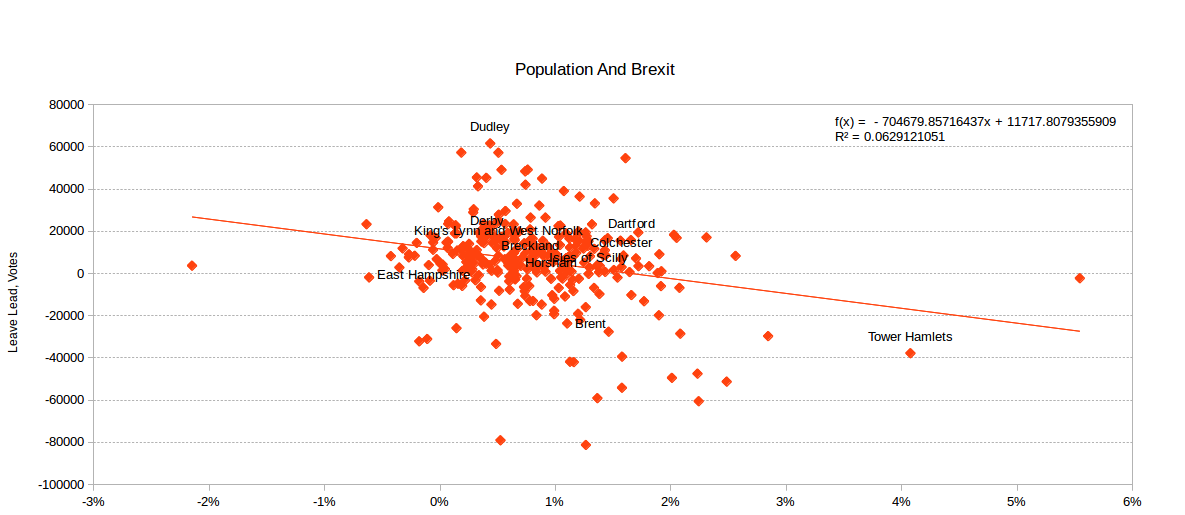
What about total population growth? Sorry, but that’s even less helpful.
We could try some other approach. The Right is convinced it’s all about immigration. The Left is convinced it was a massive protest vote about austerity. This is hard to test because there is no official data on total government spending by locality. Without it, we’d have to build our own private hell of cost-allocation problems. The Centre for Cities managed to create a snapshot for 2013-2014, but austerity is all about change in the fiscal stance. Also, a Keynesian would object that the allocation of the government deficit is what counts, so we’d need tax revenue data as well. And, anyway, it doesn’t tell us much.
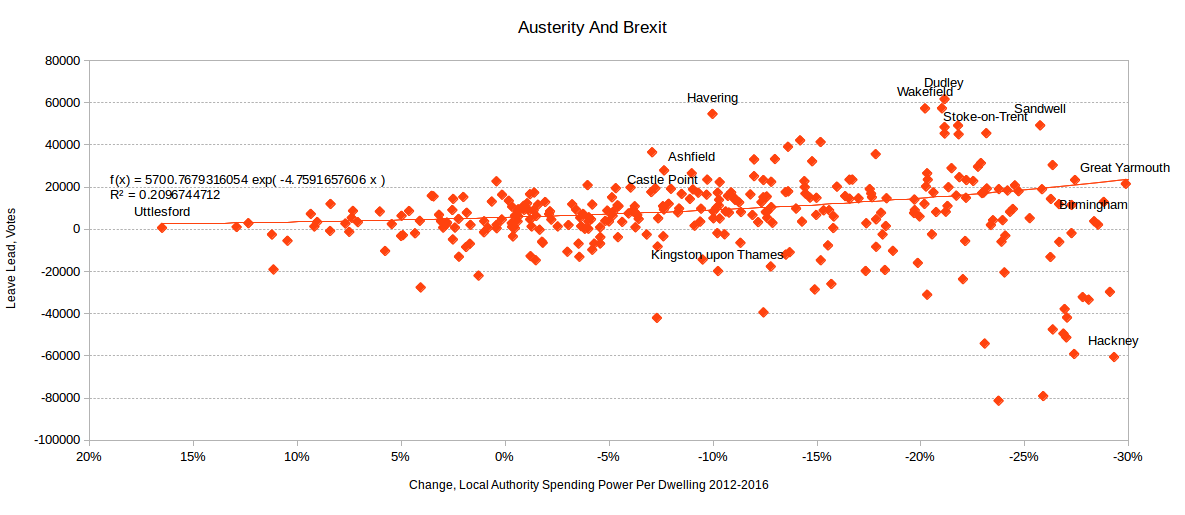
There is, however, data for spending by local governments. A large fraction of the UK austerity programme consists of cuts to the Department for Communities and Local Government’s financing to town councils, so this ought to be a useful proxy for total spending.
We don’t find much correlation with the level of spending. But we do with the change from 2012-2016. Austerity, defined as the reduction in local government spending power, predicts about 20% of the variation in the net vote for Leave.
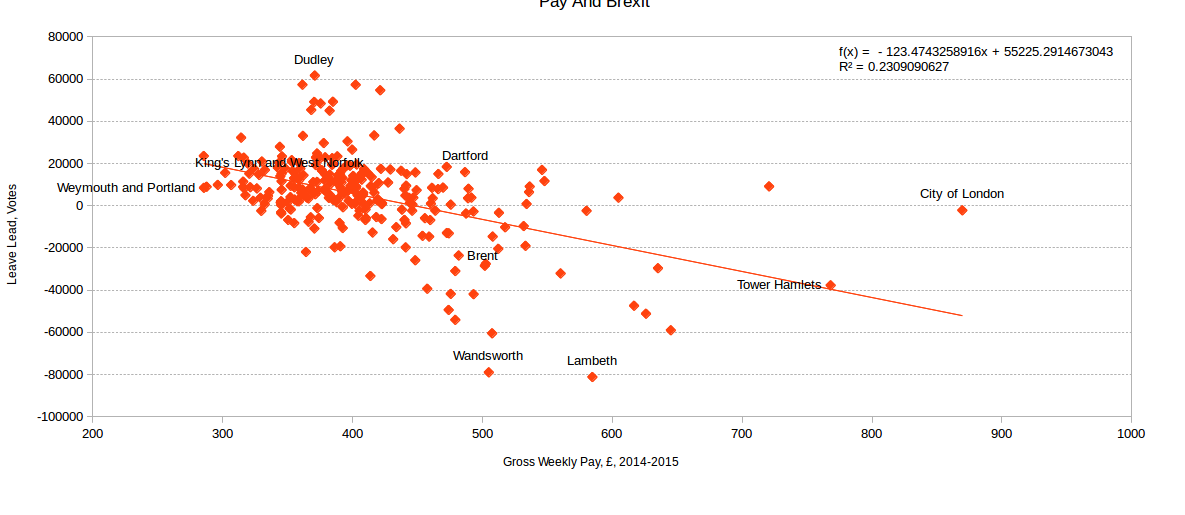
Another variable that does seem to have some predictive power is pay. The short-term change in median gross weekly earnings doesn’t seem to matter, but their level does, quite strongly. In fact, it’s better than austerity as a predictor; it’s the best one I found, with R^2 of 0.23. I ran the same analysis, using the Annual Survey of Hours and Earnings data set, for the 25th, 75th, and 90th percentiles of earners, but I didn’t find anything interesting.
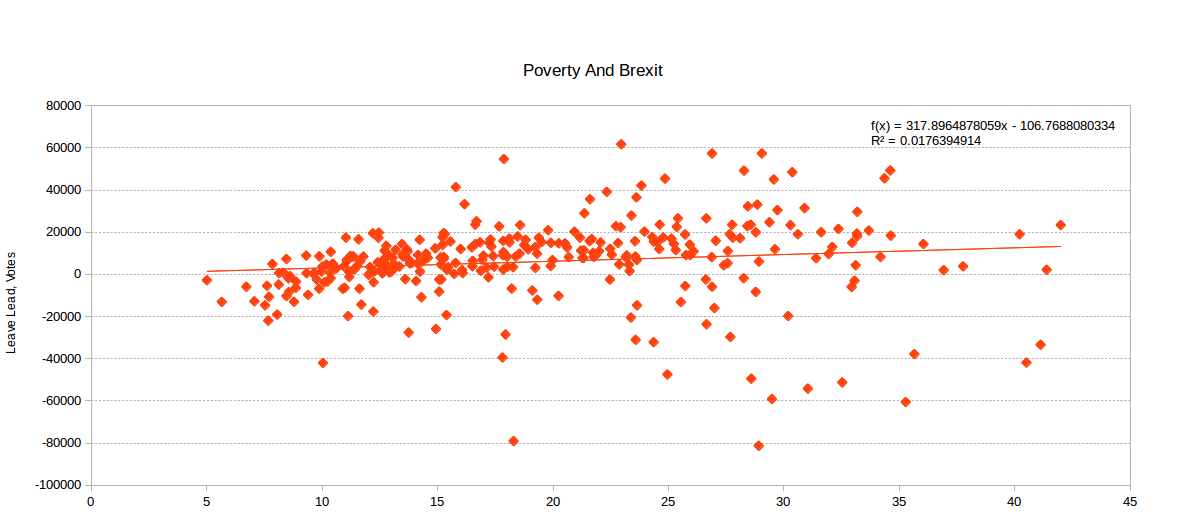
So, it looks like the immigration story is a bust. The internal migration one might be saved with a lot more nuance, and you know what they say about nuance? And a pretty direct leftwing story about austerity and poverty seems to work better than anything else. Until you actually look at poverty itself. The standard measure of poverty in Britain is the government’s Index of Multiple Deprivation, which sums up a gaggle of social evils as a handy score.
This is interesting because the IMD tells us what happened after the welfare state did its thing – it’s a measure of poverty and inequality after redistribution, while the ASHE is a measure of income as determined by the market, before taxes and transfer payments. And the IMD doesn’t seem to show any correlation at all.
Now this is interesting. A major economic and political orthodoxy throughout the world since the late 1980s has been that economic change, however jarring, is basically healthy because the winners can compensate the losers through the tax and transfer system. This doctrine was the source of legitimacy for the whole free-trade agenda – NAFTA in the States, Single Market completion and the Eurozone in Europe. And now it’s breaking down. Transfers don’t buy legitimacy, and maybe they never did.
For the UK, there’s an important and difficult problem here. The UK doesn’t do regional policy well, but redistribution of income between regions does happen to a very significant extent. Leaving aside the rows about the Barnett formula and Scottish oil, let’s just remember that 30% of all taxes paid in the UK are paid by Londoners, who make up 13% of the population. How much more are you going to ask them for?
Part of the problem is that redistribution must be done, but it must also be seen to be done, like justice. The UK, very unusually among federations, doesn’t really have an explicit political process to determine how government spending is divvied up. There’s no equivalent of a Länderfinanzausgleich. Therefore, it’s hardly surprising nobody thinks they have any control over it.
This also suggests another way economic unions fail. It’s a commonplace that the Eurozone is troubled because it lacks both a big discretionary budget and full labour mobility, unlike the United States or Germany. Therefore, bits of it can end up with an inappropriate real exchange rate and high unemployment for an indefinite period of time. But the UK doesn’t have any language barriers, and it does have a big federal budget. You could say the same for the US. However, bits of it still seem to end up stuck in a low-income equilibrium for decades.
Perhaps that internal migration hypothesis deserves another look? Perhaps, without explicit and forceful regional policy, some places just empty out? And does that remind anyone of Donald Trump?
If the Leave correlation on ASHE data disappears when you use IMD, doesn’t that suggest that redistribution *is* working?
Phil: I may be massively misreading the piece, but isn’t the point that “deprivation and Brexit” are not correlated whereas “low wages and Brexit” are correlated? So while redistribution is working to alleviate material poverty, it’s failing to make people believe that the society they live in is working for them?
This is exactly the point.
In June there was a referendum in which it was decided, by 52 to 48, to leave the EU. Leaving the EU does nothing to control migration; it does nothing to increase the control of the movement of EU nationals to/from the UK or any other kind of migration. To do that the UK has to leave the European Economic Area or it has to enter a process of negotiating continued membership of the EEA but with controls on movement of EU nationals (with low chances of success and high risks). These were not options on the ballot paper. Nor was there a question about migration controls on the ballot paper.
Yet for the last two months there has been a chorus of voices saying that we have voted for migration controls. The answer to that, in my opinion, is not to try to blind them with statistics but simply to say “no we haven’t”. Some of them may get angry when they discover that leaving the EU does nothing to control migration, but that is possibly less risky than entering the labyrinth of negotiation that migration controls imply.
Not sure about this. Your thesis is (as I understand it) that areas that have received large transfers but are low waged are likely to be voting leave, but much of the wage fit appears to be driven by areas such as tower hamlets or lambeth, which are high for both IMD and wages. That is, the difference between the two measures is not just due to transfers to low waged areas, but also due to the particular character of cities.
It’d be interesting to see the plot of which areas are discrepant between wages and IMD, and which way.
Permalink
if you’re thinking of internal migration, is it worth you looking at % of population under 30 in each area with tertiary education? Because it’s at that stage of life that the migration normally happens: I don’t think a lot of people with just A levels or no qualifications are going to leave their immediate area to get work. If you’ve got young people going off to uni and not coming back, that’s going to have a big impact, especially when tertiary education rates in the UK are among the highest in Europe.
Good point. Actually, take this cookie good for one TYR Blog!
Permalink